Look up a ZIP code or metro
Share of homes sold over list, by state
Most competitive ZIP codes this month
| ZIP | Metro | Sold over list | vs. last year | Sale-to-list | Median days | Homes sold |
|---|---|---|---|---|---|---|
| 14617 | Rochester, NY | 96% | +4.4 pts | 125.6% | 7 | 53 |
| 94707 | Oakland, CA | 94% | +1.2 pts | 133.4% | 15 | 31 |
| 14615 | Rochester, NY | 94% | +7.4 pts | 117.8% | 8 | 31 |
| 14468 | Rochester, NY | 93% | +28.8 pts | 119.0% | 8 | 28 |
| 06043 | Hartford, CT | 92% | +9.0 pts | 106.9% | 35 | 13 |
| 08823 | New Brunswick, NJ | 92% | +21.3 pts | 103.1% | 40 | 13 |
| 14616 | Rochester, NY | 92% | +5.9 pts | 125.2% | 8 | 61 |
| 94127 | San Francisco, CA | 92% | +5.4 pts | 122.1% | 12 | 61 |
| 07043 | Newark, NJ | 92% | +6.4 pts | 129.8% | 14 | 36 |
| 94132 | San Francisco, CA | 92% | +22.7 pts | 119.2% | 15 | 24 |
| 07607 | New York, NY | 92% | +4.2 pts | 104.1% | 56 | 12 |
| 94602 | Oakland, CA | 92% | +17.2 pts | 128.6% | 14 | 59 |
| 14626 | Rochester, NY | 91% | +5.2 pts | 120.3% | 8 | 58 |
| 02032 | Boston, MA | 91% | +33.8 pts | 102.3% | 15 | 11 |
| 11740 | Nassau County, NY | 91% | +24.2 pts | 102.1% | 22 | 11 |
| 94708 | Oakland, CA | 90% | +6.9 pts | 128.6% | 15 | 51 |
| 07028 | Newark, NJ | 90% | −0.3 pts | 126.7% | 17 | 20 |
| 07009 | Newark, NJ | 90% | +6.7 pts | 109.3% | 21 | 30 |
| 14526 | Rochester, NY | 90% | +3.3 pts | 118.6% | 7 | 49 |
| 14519 | Rochester, NY | 89% | +3.8 pts | 113.0% | 8 | 19 |
| 11755 | Nassau County, NY | 89% | +38.9 pts | 102.4% | 30 | 18 |
| 14580 | Rochester, NY | 88% | +6.3 pts | 115.3% | 7 | 77 |
| 07853 | Newark, NJ | 88% | +25.3 pts | 109.0% | 13 | 17 |
| 07945 | Newark, NJ | 88% | +25.9 pts | 108.7% | 14 | 25 |
| 94530 | Oakland, CA | 88% | +3.9 pts | 125.8% | 14 | 41 |
In the three months ending May 2026, ZIP code 14617 in the Rochester, NY metro area was the most competitive in the country: 96% of homes sold above their list price, at an average of 125.6% of list. It was followed by 94707 (94%) and 14615 (94%). Across all ZIP codes with sales, 26% of homes sold above list, according to a BindingOffers analysis of data provided by Redfin, a national real estate brokerage.
Download the chart (PNG)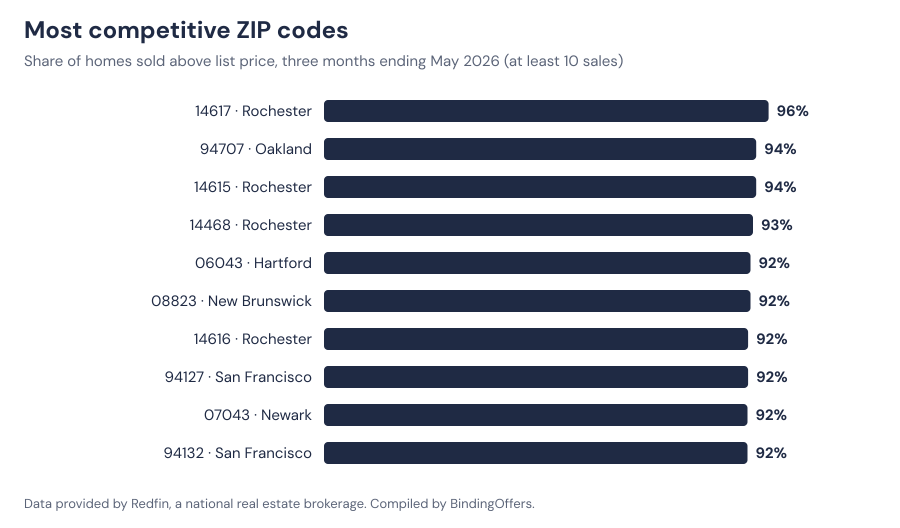
By state
| State | Sold over list | vs. last year | Sale-to-list | Median days |
|---|---|---|---|---|
| Alaska | 28% | −1.0 pts | 99.7% | 22 |
| Alabama | 18% | −0.2 pts | 97.9% | 57 |
| Arkansas | 14% | −2.2 pts | 97.4% | 53 |
| Arizona | 15% | +0.2 pts | 98.0% | 62 |
| California | 41% | +0.7 pts | 100.7% | 33 |
| Colorado | 24% | −0.8 pts | 98.8% | 35 |
| Connecticut | 63% | +0.5 pts | 103.7% | 31 |
| District of Columbia | 29% | +6.7 pts | 99.6% | 47 |
| Delaware | 34% | −0.9 pts | 99.7% | 33 |
| Florida | 11% | +0.1 pts | 96.7% | 66 |
| Georgia | 20% | −1.4 pts | 98.1% | 49 |
| Hawaii | 19% | +0.6 pts | 97.8% | 86 |
| Iowa | 23% | −2.3 pts | 98.2% | 37 |
| Idaho | 17% | +3.1 pts | 99.1% | 35 |
| Illinois | 44% | −0.6 pts | 100.4% | 43 |
| Indiana | 23% | −1.9 pts | 98.3% | 26 |
| Kansas | 18% | −0.3 pts | 97.3% | 19 |
| Kentucky | 20% | −2.4 pts | 97.8% | 45 |
| Louisiana | 12% | −0.6 pts | 97.2% | 55 |
| Massachusetts | 52% | −3.2 pts | 101.4% | 21 |
| Maryland | 40% | −2.5 pts | 100.2% | 34 |
| Maine | 30% | −8.4 pts | 98.6% | 45 |
| Michigan | 38% | −0.4 pts | 99.5% | 24 |
| Minnesota | 39% | −1.9 pts | 100.0% | 25 |
| Missouri | 24% | −1.3 pts | 98.1% | 27 |
| Mississippi | 11% | +0.6 pts | 97.4% | 47 |
| Montana | 0% | +0.0 pts | — | 69 |
| North Carolina | 19% | −3.0 pts | 98.3% | 52 |
| North Dakota | 8% | −9.7 pts | 98.3% | 44 |
| Nebraska | 42% | +10.7 pts | 100.0% | 27 |
| New Hampshire | 46% | −2.7 pts | 100.5% | 38 |
| New Jersey | 52% | −3.5 pts | 102.1% | 35 |
| New Mexico | 5% | +0.7 pts | 98.9% | 53 |
| Nevada | 21% | +1.2 pts | 98.5% | 52 |
| New York | 43% | −0.0 pts | 101.8% | 42 |
| Ohio | 37% | +1.9 pts | 99.4% | 36 |
| Oklahoma | 18% | −3.8 pts | 97.9% | 39 |
| Oregon | 31% | +0.1 pts | 99.5% | 28 |
| Pennsylvania | 38% | −0.2 pts | 99.7% | 30 |
| Rhode Island | 51% | −1.4 pts | 100.9% | 26 |
| South Carolina | 14% | −0.5 pts | 98.0% | 72 |
| South Dakota | 17% | −2.6 pts | 98.0% | 49 |
| Tennessee | 16% | +0.1 pts | 97.8% | 61 |
| Texas | 14% | +0.3 pts | 97.2% | 56 |
| Utah | 24% | −1.0 pts | 99.0% | 41 |
| Virginia | 39% | −0.2 pts | 100.1% | 28 |
| Vermont | 28% | +1.1 pts | 98.3% | 64 |
| Washington | 31% | −4.4 pts | 99.8% | 19 |
| Wisconsin | 45% | −1.2 pts | 100.5% | 44 |
| West Virginia | 24% | +2.9 pts | 97.7% | 50 |
| Wyoming | 6% | −1.3 pts | 98.1% | 51 |
City pages
The 200 largest cities by homes sold.
Methodology
The figures come from the Redfin Data Center’s market tracker, which Redfin compiles from MLS and public-records data. We import the latest release every month. ZIP-code figures cover a rolling three-month period; city and state figures cover a single month. We use Redfin’s “All Residential” series, which combines single-family homes, condos, townhouses and small multifamily properties.
Sold over list is the share of homes that sold for more than their final list price. Sale-to-list is the average sale price divided by the final list price; Redfin excludes sales 50% or more above or below list. Median days is the median time from listing to going under contract. Year-over-year changes are Redfin’s, shown in percentage points.
To keep small samples from dominating, rankings include only ZIP codes with at least 10 sales in the period. The national figure on this page is our own: the share sold over list across all ZIP codes, weighted by homes sold. It is not an official Redfin statistic and can differ from Redfin’s national numbers. Coverage varies by area, and some rural ZIP codes have no data.
BindingOffers, “Homes Sold Over Asking by ZIP Code,” May 2026, using data provided by Redfin, a national real estate brokerage. https://bindingoffers.com/data/over-asking-map
Questions
What share of homes sell over asking price?
It varies widely by location and season. This page shows the latest share for every ZIP code with sales, updated monthly from Redfin data.
What does sale-to-list ratio mean?
The sale price divided by the final list price. A ratio above 100% means homes are selling above asking on average.
How often is this updated?
Monthly, after Redfin publishes its latest market tracker. The update date is at the top of the page.